Luckily there is still organic reach on Instagram, but it is also getting tougher to reach the right people with correct messages. Despite the fact that timelines become increasingly faster, we all want our content to be seen! Here, Instagram Ads can make sense as already small investments can help to reach more interested people and engage them. In this post I will cover how to approach the analysis of Instagram ads.
This Instagram ad was targeted towards surfers in Peniche, a surf mecca located north of Lisbon with the goal of an increased number of profile visits. Due to the fact that the image was taken on one of the main streets surfers commute to spots, other surfers might recall the spot and like the image.

As in my Instagram Story Analytics post, I will take my side project wavesnbackpack as a quick example to give you some insights on private Instagram data. But now let’s jump into data and see what the terminology means. Instagram Ad Analytics - “View Insights”.
Instagram Ad Analytics - The metrics!
After you have headed to the insights section by clicking “view insights”, you see the most important Instagram Ad KPIs. The overview will vary slightly depending on the objective you chose for the specific ad, as well as organic posts.
Instagram Ad Metric #1 - Interactions
The interactions taken on this ad displays the main KPI of the ad, as the chosen goal was profile clicks. In this specific case, 148 profile clicks came from the promotion - I invested 6€ by the way - 51 were organic, which means 74% came from paid.
Instagram Ad Metric #2 - Visit website
The link in the bio was clicked three times, of which 2 were from an organic source. As achieving more website visits was not the previously set goal, this additional website click is a great side effect but nothing I would expect from this ad.
Instagram Ad Metric #3 - Discovery
Here Instagram displays the amount of people that have been reached. This number is pretty insightful for several reasons. Firstly, it is an important metric to show potential partners how many people saw the brand you might work together with. In this case, it was also necessary as the surfboard I am carrying was sponsored by a local manufacturer from Peniche, but this is just as an example. On top of the achieved likes, comments and saves this will be an important metric to share with your partner. We will get to the second reason later.

Now, we can dig deeper into this number. The amount of people who haven’t been following my channel is also an important KPI, as I want this number to be high in order to reach more people and grow respectively.
58% of 3,920 reached people came from the promotion, consequently 42% from organic. Despite the fact that the post was financially supported, hashtags and the overall good performance of the post helped to bring it to the discover section, where people that do not follow the profile were able to see the post.
Instagram Ad Metric #4 - Impressions
In contrast to reach, impressions are not unique as one person could see the same post twice. In this case people seem to have seen the post twice, as impressions are almost double the reach.
Again here, 58% came from the promotion.
Instagram Ad Metric #5 - Follows
The question of how many new followers I received because of this post is answered here. It is a great indicator for strong content and you should have a close eye on which images drive growth in terms of new followers for your account.
Here, Instagram unfortunately does not provide a break-down of organic vs paid so you only know the total number of new followers.
Which Instagram Post should I Sponsor?
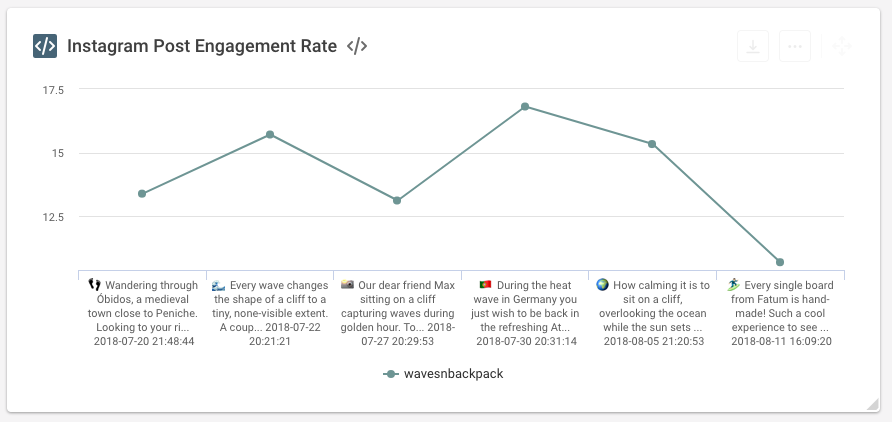
Remember before, when I mentioned reach to be important for two things? The first was the above-mentioned possibility to show a metric that could give “brand recognition” a numeric value. The second one is that reach is the foundation of the quintly Engagement Rate metric. Here we divide Instagram engagement (like, comments, saves) by reach.
On the x-axis of the metric the individual posts are shown and the engagement rate on the y-axis.

This metric shows which post in the analyzed period was “most effective”. That means which post got a high number of engagement for a relatively low reach.
Posts with a high engagement rate could perform well as an ad as people seem to have liked it, but too little saw it. Thus, this metric delivers the data-driven answer which posts are wise to promote. No investments based on gut feeling, dear marketers! Even if it’s just 6€!
Hopefully this article provided you with insights on how to approach Instagram ad analytics. If I missed something or you have a question, please leave a comment and join the discussion.
More on Instagram? There you go!
Guide to Social Media Stories and Short-form Video Content
Two competing brothers - Adidas vs Puma on social media
How does the New York Times approach Instagram?
The 10 most liked Instagram brands in the UK
Wondering how to start with Instagram Ads? Head over to our friends at buffer!


Join the conversation. Leave us a comment below!